FINDING 01
The line is 20%.
Up to 20% off, sales stayed profitable at an 11.9% margin. Every discount level above 20% made a net loss, and above 50% off every single sale lost money.
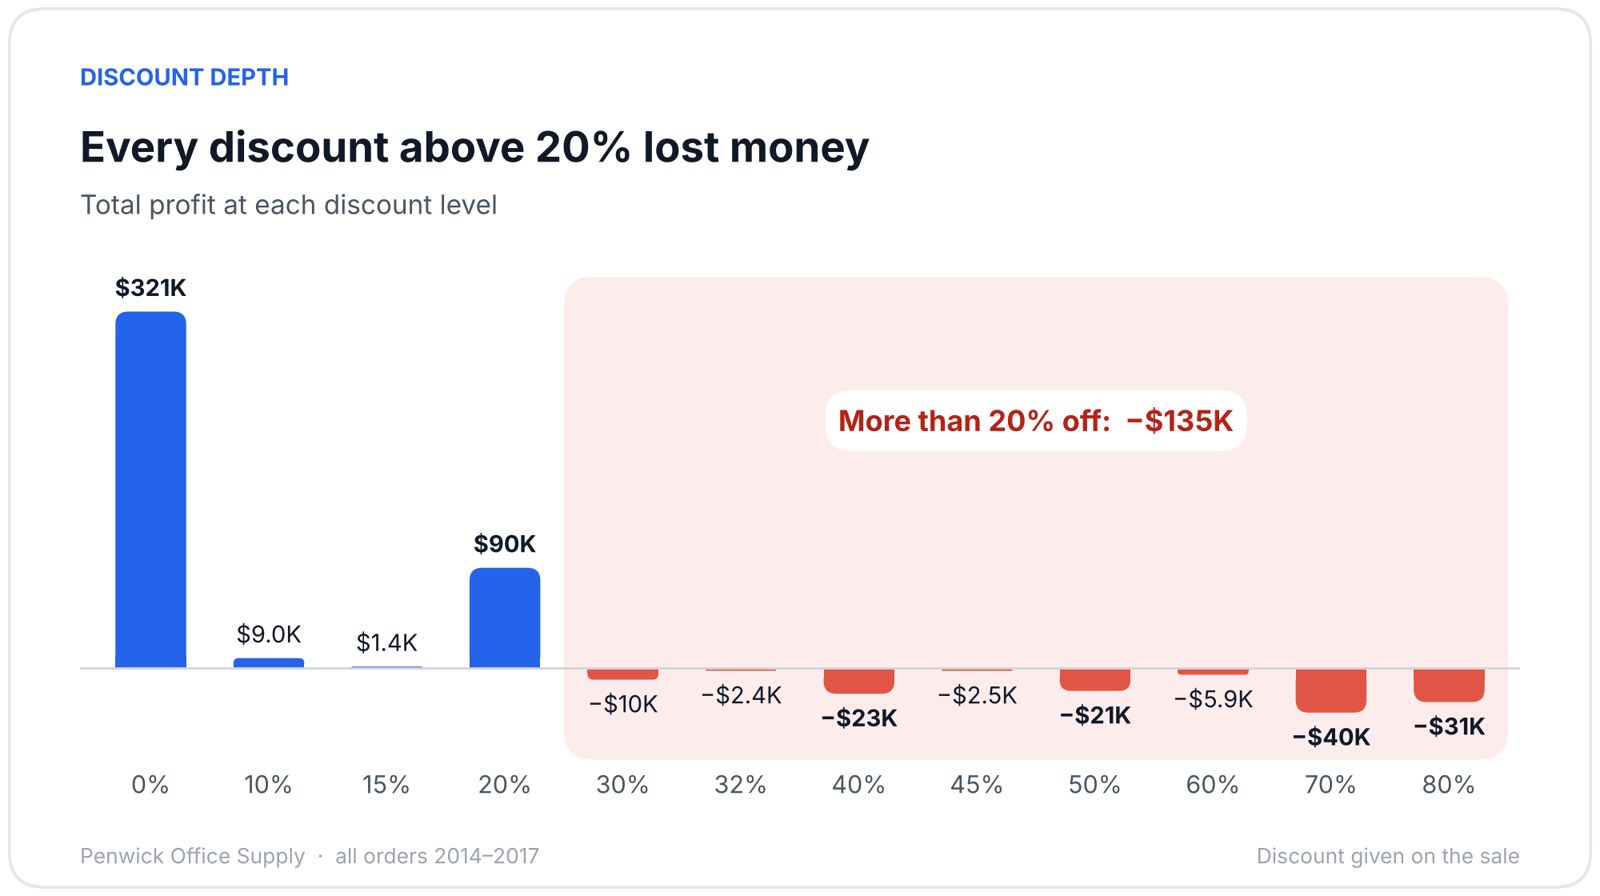
Discounts above 20% lost $135K over four years, almost half of the profit. A 20% cap was the best option I tested.
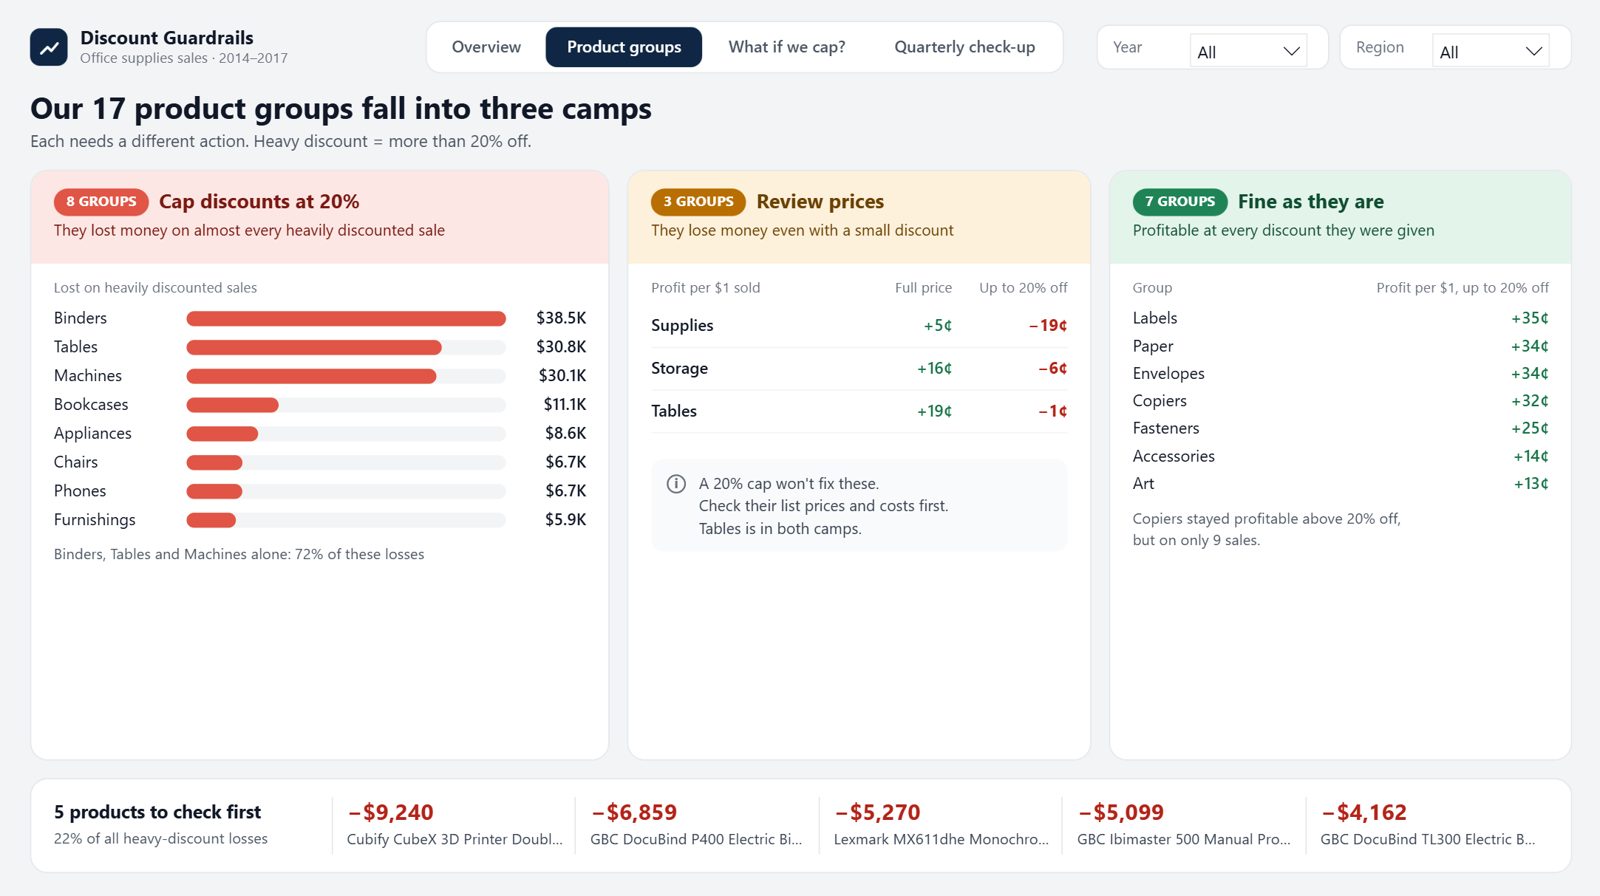
What maximum discount should each product group allow?
A US office-supply retailer took 5,009 orders between 2014 and 2017, with discounts from 0% to 80% off. The Head of Sales sets discount limits once a year. I analysed every one of its 9,994 order lines in SQL Server to give that decision a number.
Up to 20% off, sales stayed profitable at an 11.9% margin. Every discount level above 20% made a net loss, and above 50% off every single sale lost money.
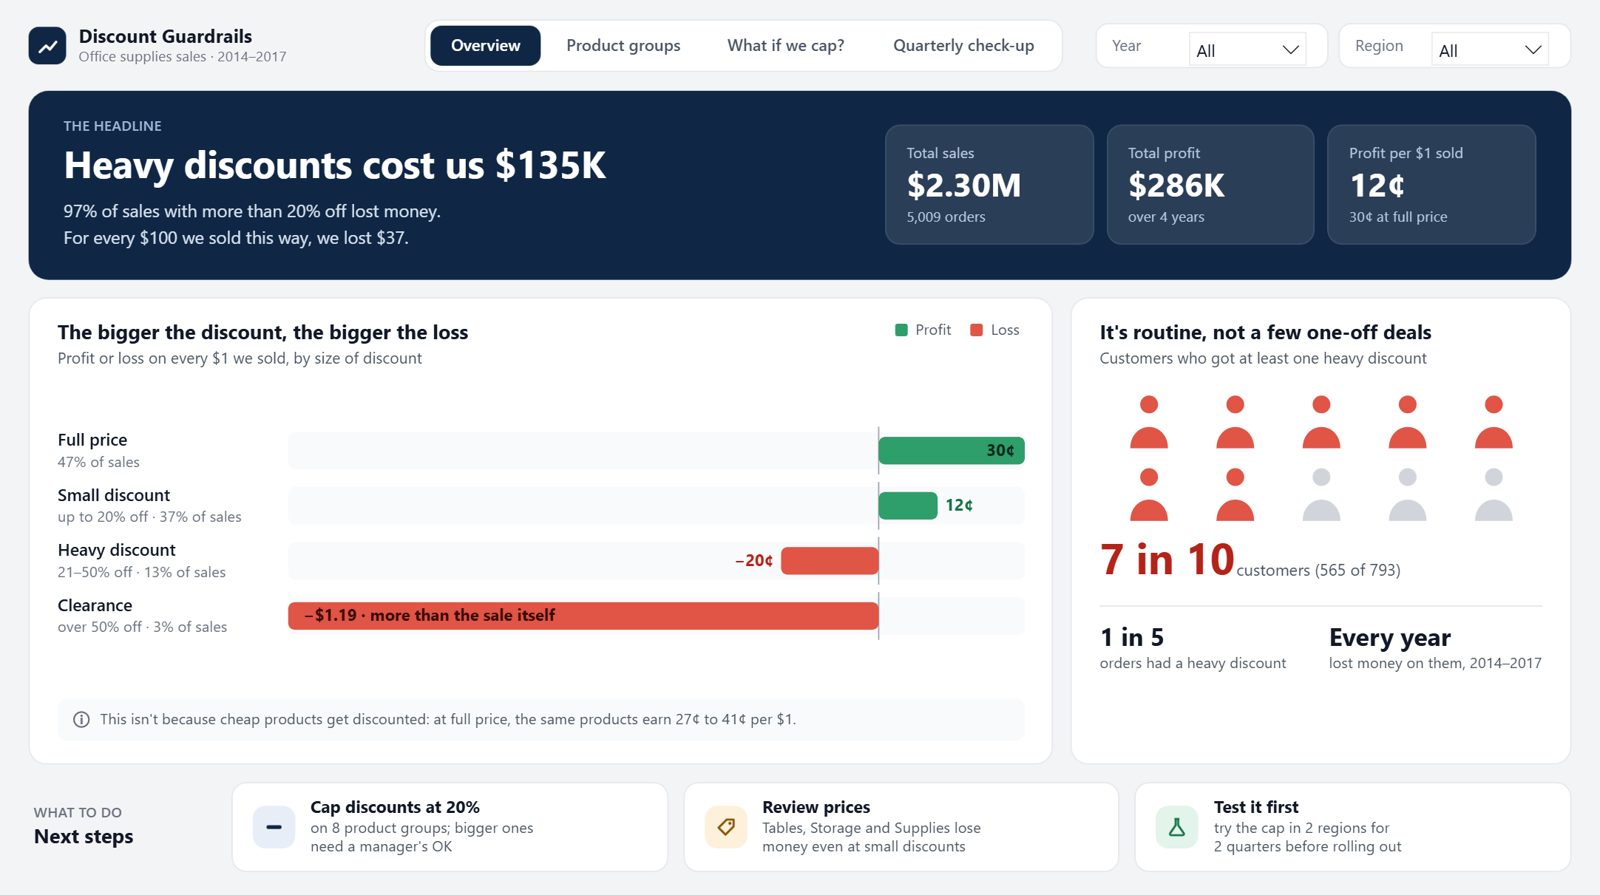
The products sold at 30–50% off make 27¢ on every $1 at full price, close to the company average. At those discounts they lost 20¢. And it was routine: 565 of 793 customers got at least one discount above 20%.
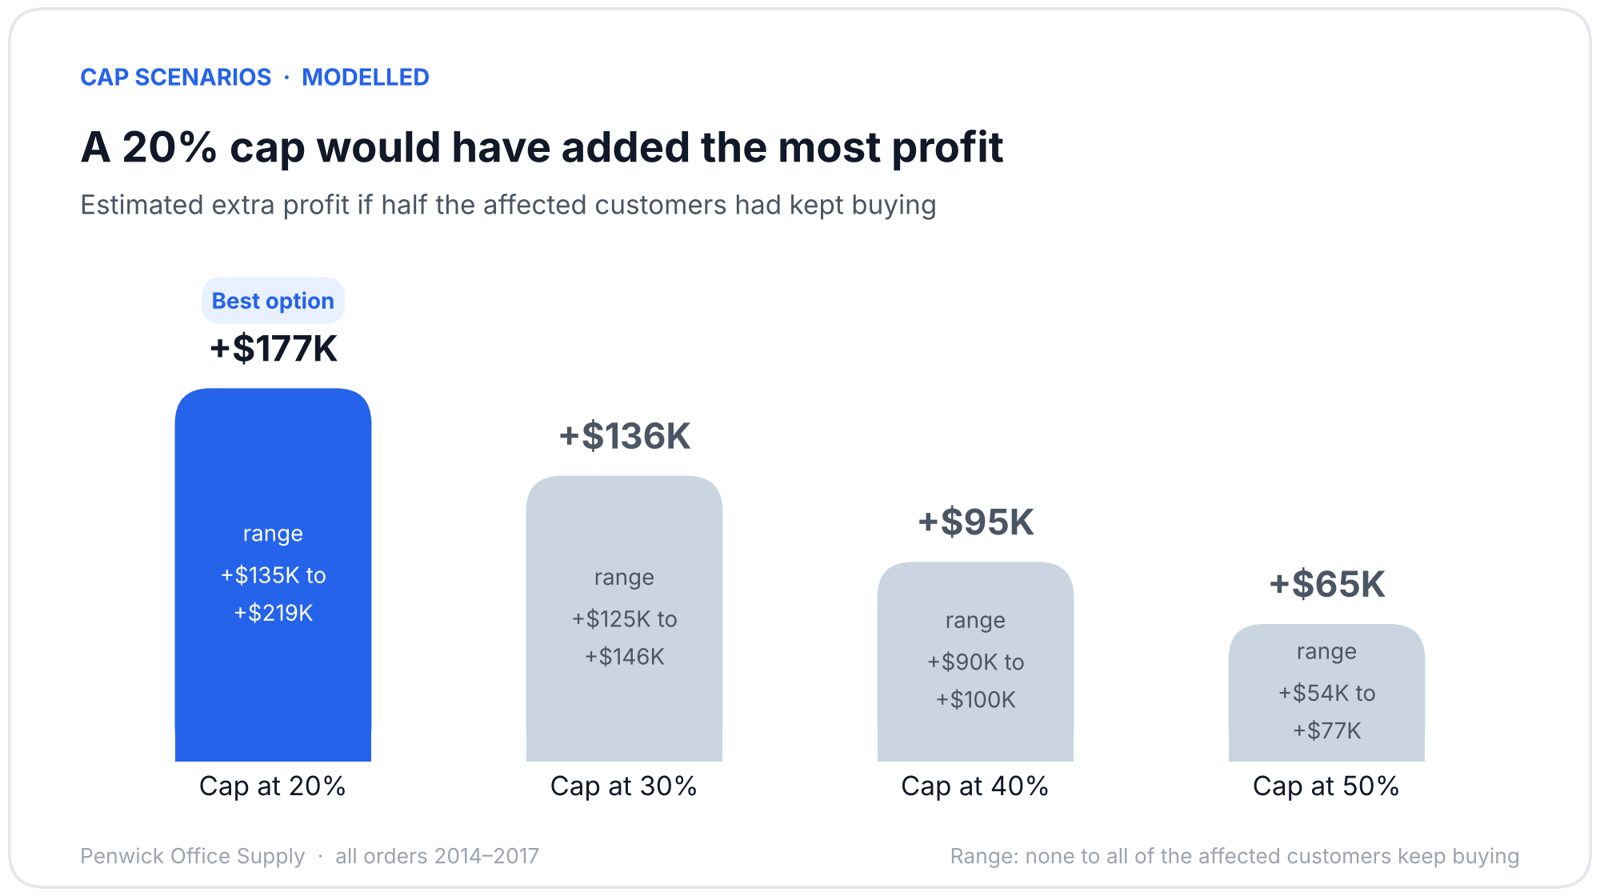
I re-priced every past order under caps from 20% to 50%. The 20% cap adds the most profit under every assumption. Tables, Storage and Supplies still lose money even at up to 20% off, so they need a price review as well.
Binders, Tables, Machines, Bookcases, Appliances, Chairs, Phones, Furnishings
Tables, Storage, Supplies: losing money even at up to 20% off
Labels, Paper, Envelopes, Copiers, Fasteners, Accessories, Art