FINDING 01
Two rushes make the day.
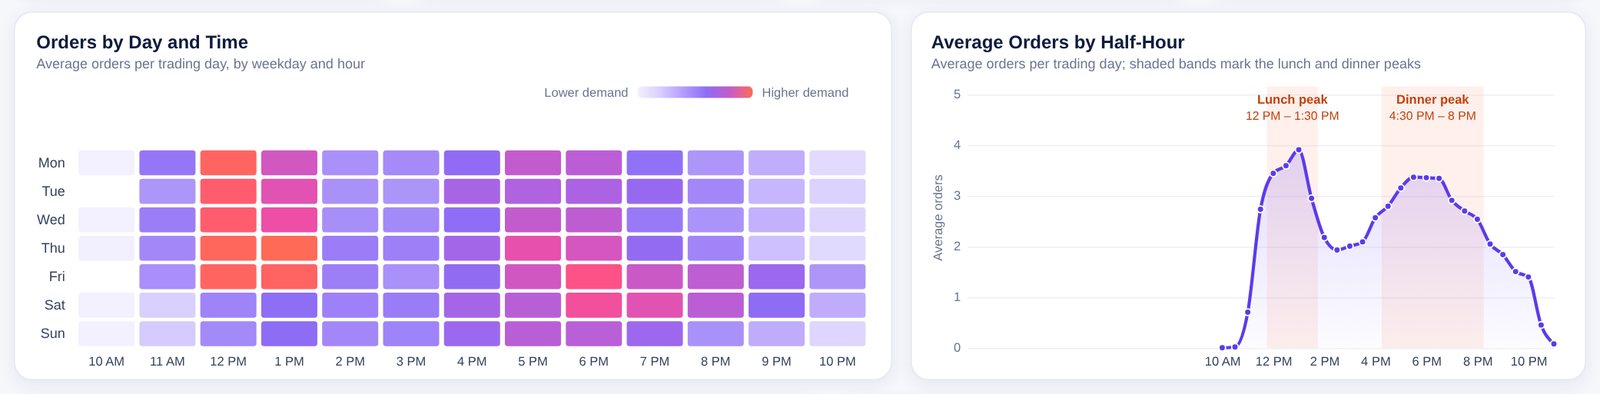
56% of revenue arrives in about five hours: lunch (12:00–1:30 PM, 21%) and dinner (4:30–8:00 PM, 35%). Friday is the busiest day at 70.8 orders, and Sunday the quietest at 50.5.
Sales were flat in 2015, so growth has to come from serving the rushes better, selling bigger baskets and rostering staff where the customers are.
When does the money come in, which pizzas earn it, and is the roster right?
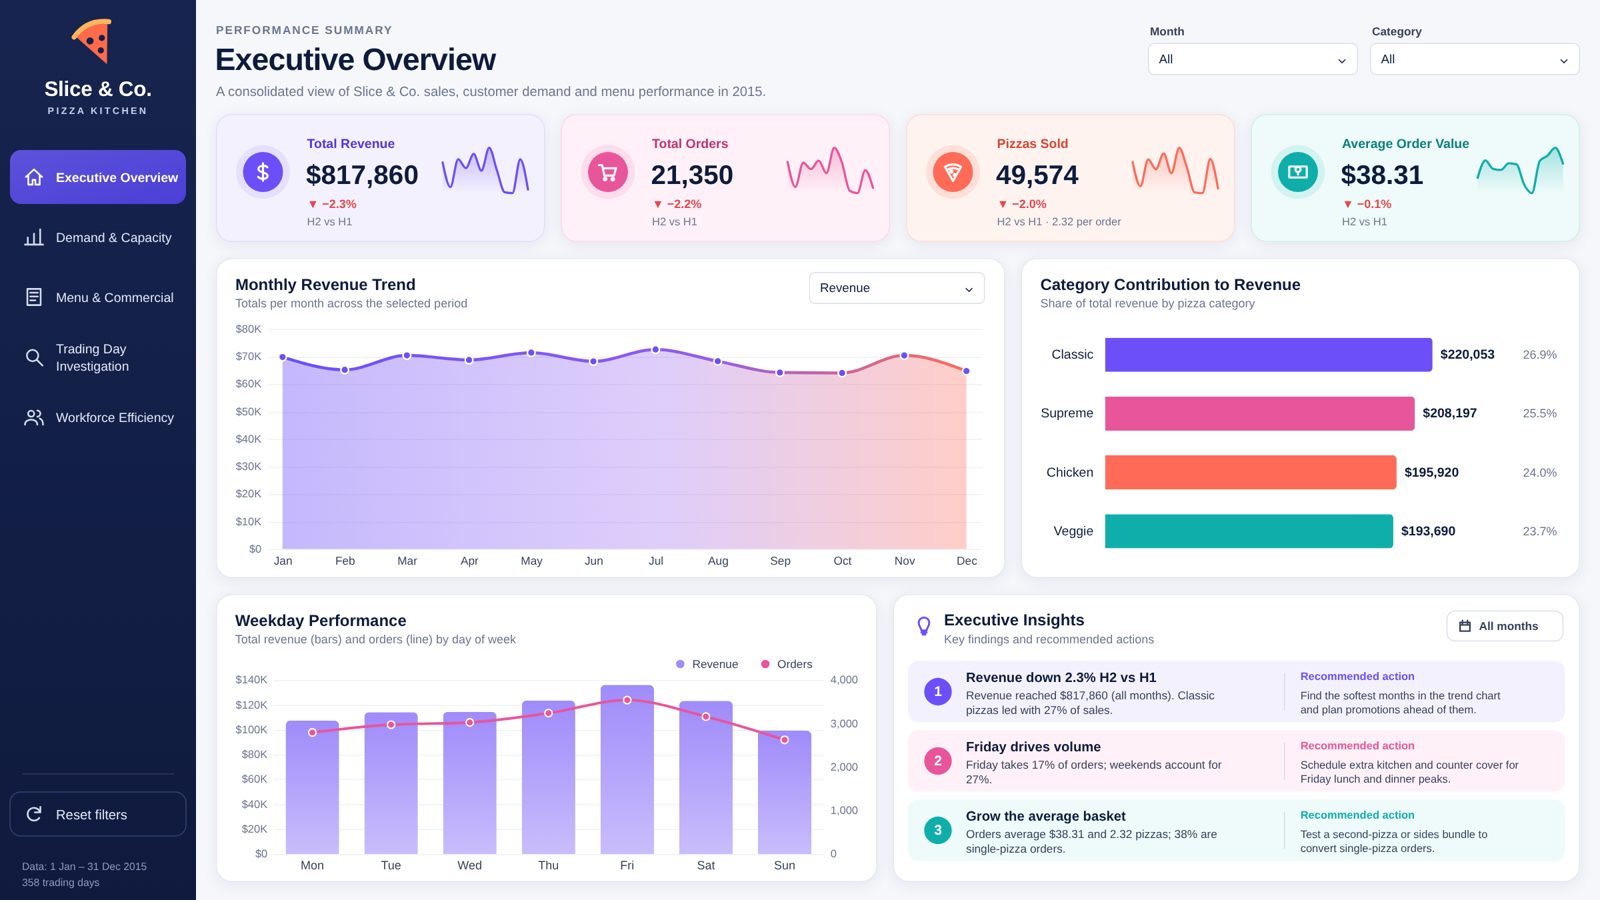
Slice & Co. is a single-site pizza kitchen selling 32 pizzas across four categories and five sizes. In 2015 it took 21,350 orders worth $817.9K. The General Manager could see the daily takings, but not when the money came in, why some days were different, or whether staff were on at the right times. I analysed all 48,620 order lines.
56% of revenue arrives in about five hours: lunch (12:00–1:30 PM, 21%) and dinner (4:30–8:00 PM, 35%). Friday is the busiest day at 70.8 orders, and Sunday the quietest at 50.5.
38% of orders are a single pizza, averaging $16.52 against $51.66 for multi-pizza orders. If 1 in 10 of them added a second pizza, revenue would rise by about $13K a year with no new customers.

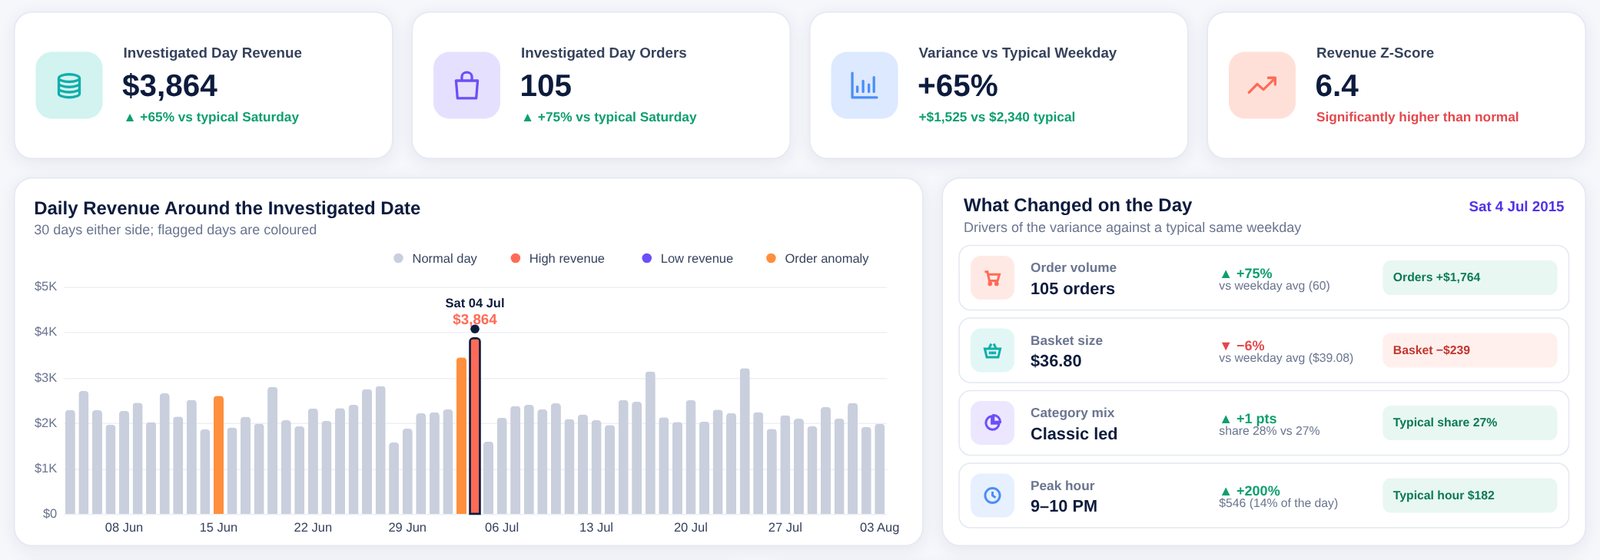
21 days stood out against a typical same weekday. The biggest spikes fell on Independence Day, Thanksgiving, Black Friday and Super Bowl Sunday (+65% to +89%), and came from more customers, not bigger orders.
The staffing data is a synthetic scenario, disclosed in the README. The roster rule is a sizing signal, not a final roster.
Finish prep before 11:30 AM and 4:30 PM, and put the strongest team on Friday lunch and Friday 5–7 PM.
Offer a second pizza or a side with every single-pizza order: about +$13K a year if 1 in 10 converts.
Reprice or resize Brie Carre, stagger afternoon shift starts and give Sunday a lighter roster.